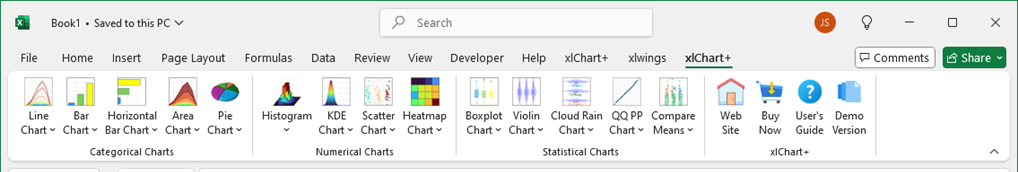
xlChart+ (or xlChartPlus) is an add-in used to extend Excel’s charting capabilities. It is very user-friendly and doesn’t require any programming knowledge. The add-in uses a series of custom functions, allowing users to create charts just like using formulas.
| Button | Description |
| 2D Point Chart | Creates a line chart |
| 2D Line Chart | Creates a smoothed line chart |
| 2D Line+Marker | Creates a 2d line chart with markers |
| Smoothed Curve | Creates a smoothed line chart |
| Smoothed Curve+Marker | Creates a smoothed line chart with markers |
| 3D Line | Creates a 3d line chart |
| 2D Clustered | Creates a bar chart |
| 2D Stacked | Creates a stacked bar chart |
| 2D 100% Stacked | Creates a 100% stacked bar chart |
| 3D Rectangular | Creates a 3d rectangular bar chart |
| 3D Cylindrical | Creates a 3d cylindrical bar chart |
| 3D Square Pyramid | Creates a 3d square pyramid bar chart |
| 3D Cone | Creates a 3d cone bar chart |
| 2D Clustered | Creates a horizontal bar chart |
| 2D Stacked | Creates a horizontal stacked bar chart |
| 2D 100% Stacked | Creates a horizontal 100% stacked bar chart |
| 3D Rectangular | Creates a 3d horizontal rectangular bar chart |
| 3D Cylindrical | Creates a 3d horizontal cylindrical bar chart |
| 3D Square Pyramid | Creates a 3d horizontal square pyramid bar chart |
| 3D Cone | Creates a 3d horizontal cone bar chart |
| 2D | Creates a 2d area chart |
| 3D | Creates a 3D area chart |
| 2D | Creates a 2d pie chart |
| 3D-Type 1 | Creates a 3d type 1 pie chart |
| 3D-Type 2 | Creates a 3d type 2 pie chart |
| 3D-Type 3 | Creates a 3d type 3 pie chart |
| Doughnut | Creates a doughnut chart |
| Univariate-Single Color | Creates a univariate histogram filled with single color |
| Univariate-Colormap | Creates a univariate histogram filled with a colormap |
| Bivariate | Creates a bivariate histogram |
| Binscatter | Creates a binscatter chart |
| Univariate KDE Curve | Creates a kernel density estimation chart |
| Univariate KDE Filled Curve-1 Color | Creates a kde chart filled with single color |
| Univariate KDE Filled Curve-1 Gradient | Creates a kde chart filled with 1 color gradient |
| Univariate KDE Filled Curve-Colormap | Creates a kde chart filled with a colormap |
| Univariate Complex KDE Curve | Creates a complex kde chart with a colormap |
| Bivariate KDE Surface and Contour | Creates a bivariate kde surface and contour plot |
| Ridge Chart | Creates a ridge chart |
| scatter | Creates a scatter chart |
| jitterscatter | Creates a jittered scatter chart |
| regscatter | Creates a regular scatter chart |
| Normal Heatmap | Creates a normal heatmap |
| Circle Heatmap | Creates a circle heatmap |
| Square Heatmap | Creates a square heatmap |
| Triangular Square Heatmap | Creates a triangular square heatmap |
| Boxplot-1 Color | Creates a monochrome boxplot |
| Boxplot-1 Gradient | Creates a two-color gradient boxplot |
| Boxplot-Colormap | Creates a multi-color boxplot |
| Boxplot-Horizontal | Creates a horizontal boxplot |
| Boxplot-Colormap Gradient | Creates a multi-color gradient boxplot |
| Violin-Type 1 | Creates a violin plot |
| Violin-Type 2 | Creates a violin plot+boxplot |
| Cloud Rain-Type 1 | Creates a cloud rain plot-type 1 |
| Cloud Rain-Type 2 | Creates a cloud rain plot-type 2 |
| Cloud Rain-Type 3 | Creates a cloud rain plot-type 3 |
| QQ Plot | Creates a QQ plot |
| PP Plot | Creates a PP plot |
| Scatter+Bar | Creates a scatter bar chart |
| Scatter+Boxplot | Creates a scatter boxplot chart |
| pair | Creates a pair chart |
| Boxplot+Pair | Creates a box plot + pair chart |
| Error+Bar+Pair | Creates an error bar chart +bar chart+pair chart |
| Web Site | Click to visit our web site https://www.chartaddin.com |
| Buy Now | Click to visit then order page |
| User’s Guide | Click to download the pdf file of user’s guide |
| Demo Version | Click to see the limitions of the demo version. |